
Bitcoin, Hyperliquid and Zcash are showing potential rebound setups after recent price corrections, according to technical analysis shared by Ali Charts on October 22, 2026. The analyst highlighted new buy signals from the TD Sequential indicator across all three assets, following earlier sell signals that appeared near local price highs. Whether the signals lead to sustained recoveries will depend on buyers stepping in at key support levels.
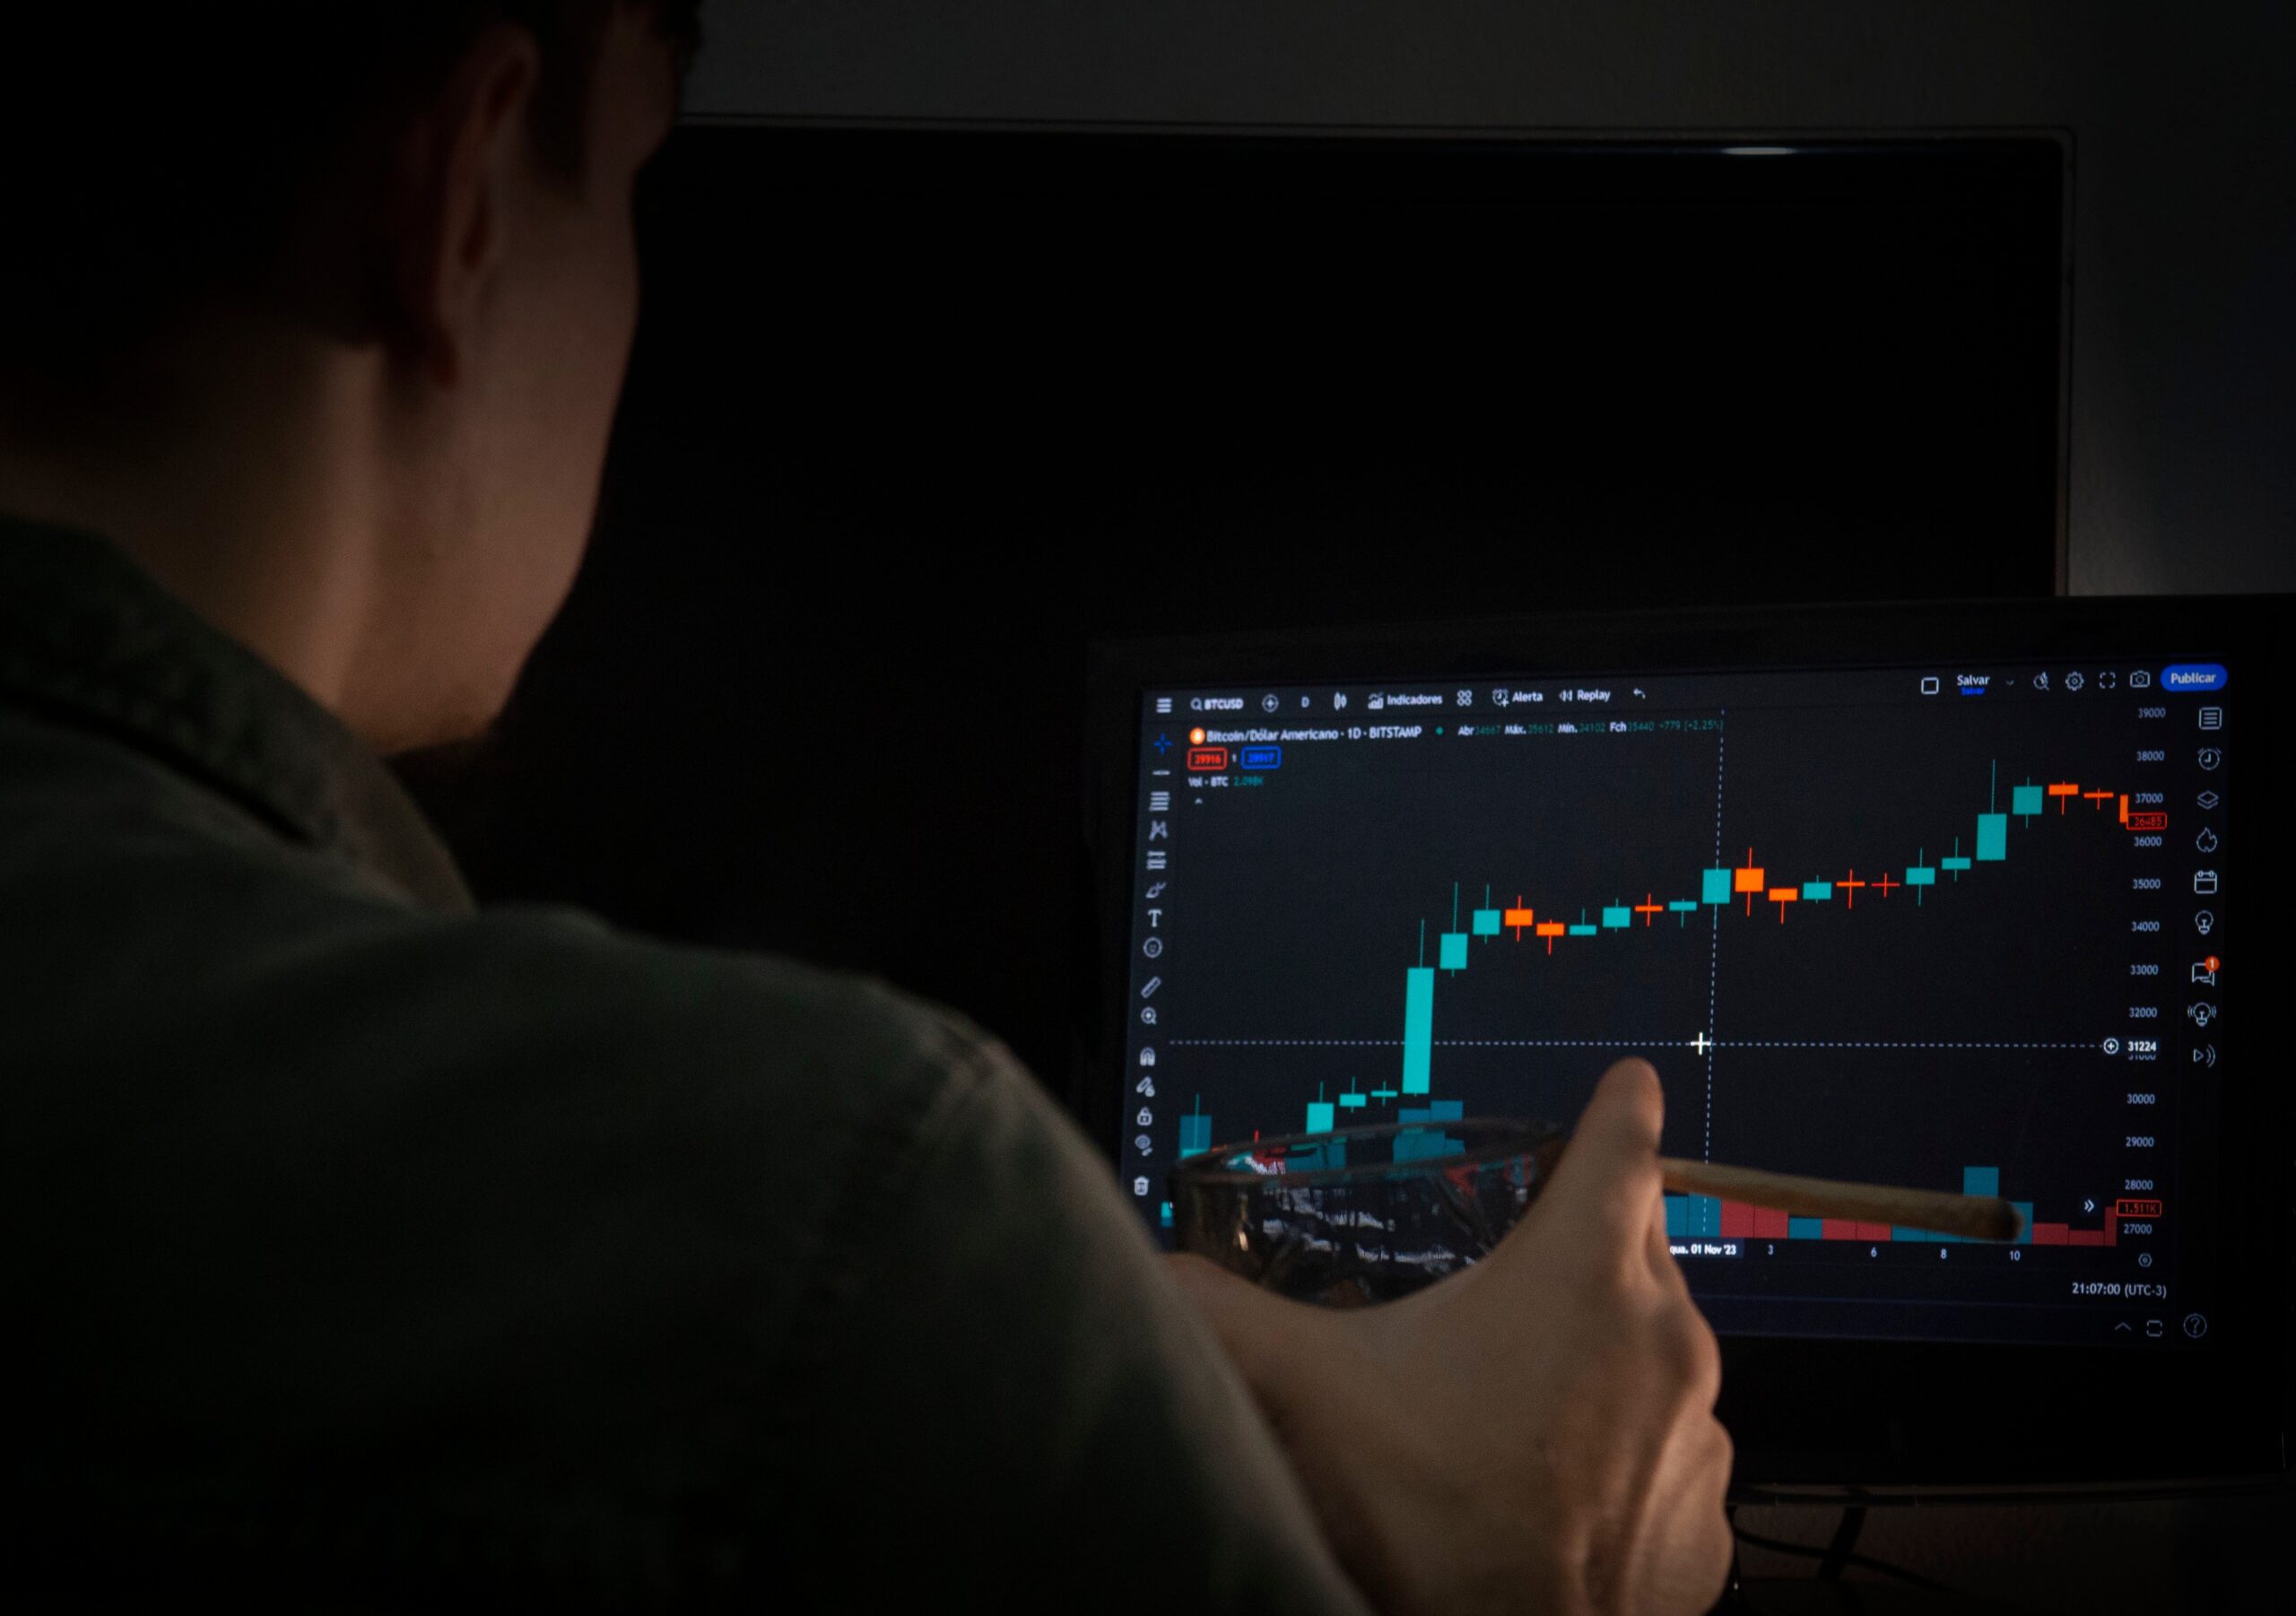
Bitcoin approached $85,000 before the TD Sequential indicator flashed a sell signal, followed by a 2.80% correction toward $82,000. The same indicator has since produced a buy signal, suggesting that the pullback could be losing momentum. However, a technical signal does not confirm that a price bottom is in place, and Bitcoin would need renewed buying pressure to establish a stronger recovery.
Bitcoin and HYPE Watch Key Support Levels
The Bitcoin setup places attention on the area around $82,000 after the correction from its recent high. If buyers defend this level and push the price higher, the market could attempt another move toward $85,000. A break below support, however, could weaken the rebound scenario and expose the asset to further selling pressure.
The TD Sequential is commonly used by traders to identify potential trend exhaustion. It counts price candles under specific conditions to highlight when an existing move may be running out of momentum. A sell signal can appear near a local top, while a buy signal may emerge after a decline. These signals are not guarantees of reversals and can fail when a strong trend continues.
Hyperliquid’s HYPE token displayed a similar sequence. According to Ali Charts, a TD Sequential sell signal appeared near a local high around $82, preceding a 4.22% correction. The indicator has now flashed a buy signal on the hourly chart, with $78 identified as the key level to watch.
If HYPE holds above $78 and buyers regain control, the token could attempt a recovery toward $82 or higher. That scenario remains conditional, as the hourly timeframe can produce signals that quickly lose relevance when market volatility increases. A sustained move above the previous high would provide stronger evidence of recovery than the indicator alone.
Zcash Traders Focus on $1,250 Support
Zcash has also experienced a pullback following a TD Sequential sell signal near $1,350. Ali Charts reported that ZEC corrected by 6.44% before the indicator generated a new buy signal. The analyst is now watching the $1,250 area as a potential support zone that could determine whether the asset attempts another move toward its previous local high.
A successful defense of $1,250 could give ZEC room to recover toward $1,350, although the market would still need to overcome selling pressure along the way. If support fails, traders may reconsider the short-term bullish setup. The reported levels are technical reference points rather than confirmed floors or ceilings.
The similarities across BTC, HYPE and ZEC are notable: each asset recorded a sell signal near a local high, experienced a correction and then produced a buy signal. This pattern may attract traders looking for signs that selling pressure is fading, but it does not establish that the three markets will move in the same direction.
Investors should also consider broader market conditions, trading volume and whether price action confirms the signals. A rebound accompanied by stronger buying activity would offer more evidence of renewed demand, while weak follow-through could leave prices vulnerable to another decline.
For now, Bitcoin’s $82,000 area, HYPE’s $78 support and Zcash’s $1,250 level are the main prices highlighted in the analysis. The next moves will show whether buyers can turn the latest TD Sequential signals into sustained recoveries or whether the recent corrections have further room to run.
About The Author